Definitions and DQOs
Information on this page:
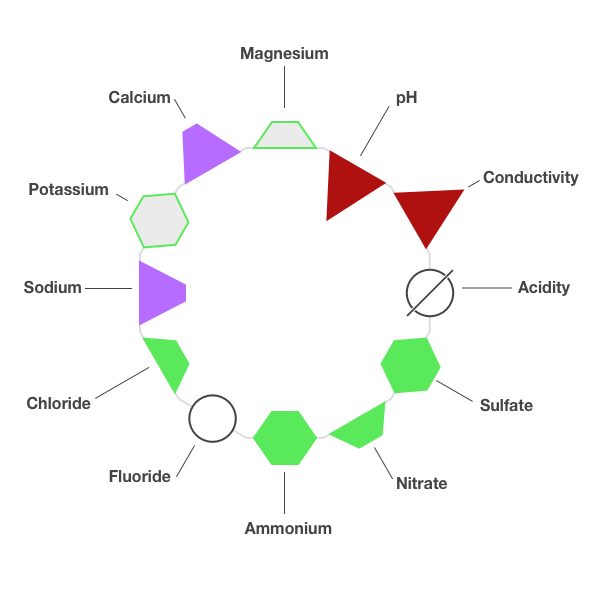
Full Ring Diagram Example
General rule
All measurements displayed as solid green hexagons or trapezoids meet Data Quality Objectives (DQOs). All other measurements do not meet DQOs.
Good - green hexagon
A good measurement is within the interquartile range (IQR), defined as the 25th to 75th percentile or middle half of the measurements. Sulfate and ammonium are good measurements that meet the Data Quality Objectives or DQOs (see Table 1, below). For a measurement within the IQR that fails to meet the DQO, the green hexagon has a gray fill (see potassium).
Satisfactory - green trapezoid
A satisfactory measurement is outside of the IQR but within the range defined by the median ±(IQR/1.349). The ratio, IQR/1.349, is the non-parametric estimate of the standard deviation, sometimes called the pseudo-standard deviation. A measurement that is outside of the median ±1 standard deviation but meets the DQO is an exception to this definition. It is set automatically to satisfactory. Nitrate and chloride are satisfactory measurements that meet the DQOs. When a satisfactory measurement fails to meet the DQO, the green trapezoid has a gray fill (see magnesium).
Marginal - purple trapezoid
A marginal or marginally acceptable measurement is outside the range of satisfactory measurements but inside the range defined by the median ±2(IQR/1.349). Marginal measurements fail to meet the DQOs. Examples are sodium and calcium.
Consider a review of sample handling and laboratory procedures
Biased - red triangle
A biased measurement is outside the range of marginal measurements ( >2 standard deviations from the median). Biased measurements fail to meet the DQOs. Examples are pH and conductivity.
Corrective actions in sample handling or laboratory procedures may be needed to eliminate biases.
Detection Limit - open circle
Measurement is below the detection limit of the laboratory’s analytical method. Fluoride is an example.
No Measurement - circle with slash
Measurement was not reported. Acidity is an example.
Notes
- An outward pointing trapezoid or triangle indicates the measurement is high. An inward pointing trapezoid or triangle indicates the measurement is low.
- Data Quality Objectives or DQOs are listed in Table 1, below. DQOs are defined in Appendix A of the Manual for the GAW Precipitation Chemistry Programme. The Science Advisory Group for Total Atmospheric Deposition met in 2017 and decided to update the DQOs based on Inter-laboratory Comparison Study results. The changes, listed in red, became effective on 1 January 2018 and will be used in Inter-laboratory Comparison Studies after this date.
Table 1. Precipitation Chemistry - Data Quality Objectives
| Measurement | DQO (before January 2018) | DQO (effective January 2018) |
|---|---|---|
| pH < 4.00 | ±0.07 units | ±0.05 units |
| pH 4.00 - 4.99 | ±0.07 units | ±0.07 units |
| pH > 5.00 | ±0.07 units | ±0.10 units |
| conductivity | ±7% | ±7% |
| acidity | ±25% | ±25% |
| sulfate | ±7% | ±5% |
| nitrate | ±7% | ±5% |
| ammonium | ±7% | ±7% |
| fluoride | none | ±20% |
| chloride | ±10% | ±10% |
| sodium | ±10% | ±10% |
| potassium | ±20% | ±20% |
| calcium | ±15% | ±15% |
| magnesium | ±10% | ±10% |
Bias Analysis
Criteria for identifying biases in the measurement record:
- Median Z-score that is > +3.00 (bias high) or Z-score < -3.00 (bias low).
- Two consecutive median Z-scores > +2.00 (bias high) or < -2.00 (bias low).
- Ten consecutive median Z-scores > 0.0 (bias high) or < 0.0 (bias low).